
How badly is streaming cutting into linear TV audiences? How much do cinema exhibitors lose when studios stream at the same time? How is the market changing through Covid?
Hard, crucial questions, hidden in secrecy. We will use some results from innovative approaches to the measurement problem which are gaining traction as traditional ratings company Nielsen gets further and further into trouble. Just last week, the accreditation group Media Rating Council suspended its seal of approval after persistent complaints that it underquotes audiences.
The numbers are huge (and will be quoted in US$). According to The Wall Street Journal, advertisers spent $70.6 billion on network television and cable in 2019, which dropped nearly $9 billion in 2020 as Covid bit. That $70 billion number has remained remarkably stable since at least 2014, without counting inflation.
Digital advertising was worth $32 billion, climbing to $41.5 billion as the pandemic kept citizens at their screens and retail went online. Despite the coincidence, this was not just a neat swap from one medium to another. In theory, the US linear providers should bounce back to nearly $70 billion and hold steady, while they are matched by digital in 2022, and then become the smaller partner.
In other words, the US broadcast and cable market has found a stable income base. Or has it? These figures just compare broadcast video ads with digital video ads. It is a reassuring sign, but only if the video advertisers convince their clients that this particular form of advertising is worth the money.
Meanwhile, all forms of digital advertising continue to rocket up. US figures climbed from $50 billion to $90 billion in 2017.
Samba TV, the newish analysis service carving out a space in the mess, uses data provided by panels of smart TVs talking to company computers about their owners’ viewing choices. Now it can compare Covid quarter 2 in 2021 with Covid quarter 2 in 2020, so we can see what is really going on. Samba also provides international data. (Sorry, major US news outlets).
Linear TV
Samba wants to know how linear TV is performing, which includes cable, in comparison to streaming services. In Australia those numbers are likely to be confused by the ABC and Foxtel. But they are still interesting figures.
The average daily linear household reach in Australia for this quarter was up 7% compared to a pre-Covid 2019 quarter. But they were down 10% compared to the first pandemic quarter. The figures shot up and have declined since, but not as far. Covid continues, of course.
The number of linear minutes watched in Australia is up by 39% compared to a comparable quarter in 2019. The increase is most evident during the day and shrinks to nothing by mid evening.
Compared to 2019 reach figures, the current numbers vary across Australia. They decline in some regional centres but go up in capitals – 5% Brisbane, 8% Sydney, 3% Canberra, 7% Melbourne, 5% Adelaide and 3% in Perth. Why Launceston is up by 5% and Hobart is down by 3% is a mystery, but the 22% rise for Shepparton is a truly strange national outlier.
The report also compares the first and second quarters of 2021 in terms of rising or falling market shares per network. The Foxtel numbers are all over the place, partly as the subscription services reshapes its offering, but generally we can see that Nine is down 2%, SBS and Seven are stable, ABC and ABC Kids are up 5%, while Ten gained 7%.
Streaming
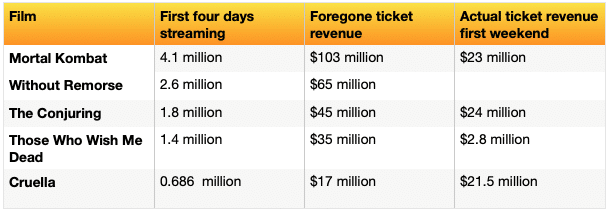
The impact of simultaneous cinema and streaming releases has not been shouted from the heights by the studios. But Samba is in the box seat to reveal the numbers. It turns out that half to 3/4 of the revenue over the first month is made in the first four days – which is an enormous rush, suggesting they tend to be fans.
We really want to know how much the streaming release cuts into traditional revenue. We have worked out a playful but instructive way of looking at the available figures. In Australia, each stream is assumed to reach an audience of 2.8 people, because they watch in groups. I think of Netflix viewers as one person with a dog and a bottle of gin but I obviously belong to a subculture. So we can imagine that each premium stream replaces 2.8 cinema tickets; that is not likely but it does give us a useful maximum.
Before the pandemic, some US films were scoring enough money to run a small country in their first weekend. The record is held by Avengers: Endgame with $357 million in 2019.
Here is a chart for major films released in the last quarter which were streamed simultaneously. The foregone revenue figures are not outlandish.
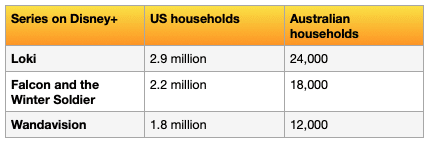
The report also breaks out the first episodes of three Marvel miniseries over their first eight days. We can compare their reception in the US with Australia. Disney+ has a long way to go here..
Counting the amount of caring
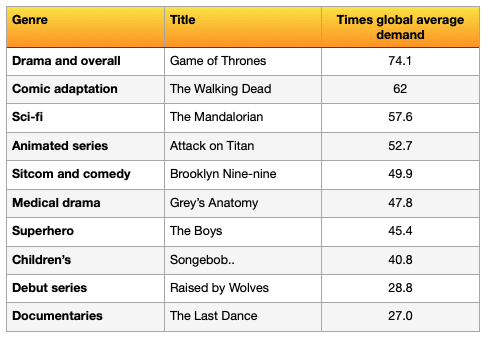
Parrot Analytics is still covering Australia, but more gently than Samba TV. Rather than measuring what we watch, it tries to assess demand by working through social media traffic and the content of comments. It creates a baseline which is the average response of any streaming program which it considers to be of international interest. Then it judges shows as multiple of that baseline to get a kind of wow factor analysis.
Ever eager to publicise itself, Parrot has done a deal with the Guinness Book of Records, to work out the most in-demand shows around the world in ten key genres, which it also rates on popularity. All the answers turn out to be US shows in English, with a spread of American services which don’t include Netflix.
The results from 1 March 2020 to 28 February 2021, which is the US financial year, are these:
The fate of conventional ratings
Don’t write off the the old familiar ratings charts just yet. Nielsen employs 44,000 people in 100+ countries to collect $6.3 billion in revenue each year. It is promising a massive rebuild of its offering to finally emerge in 2023 and has finally been persuaded to fix its reputation problem as soon as possible.
Oztam is now counting co-viewing in its broadcast VOD numbers, as it too moves with the times. Around 15-20% of all screenings involve more than one person, which can be any number from 2-5+. Reverse those numbers and think of 80% of iView etc viewers watching their smart TVs by themselves, and you might feel a bit sad.